
In one sentence: you need fewer indicators than you think, and the ones you keep should all be answering the same question — is this move for real — from different angles, not adding new opinions to the pile.
Why indicator overload actively hurts beginners
Open a new trader's chart and you'll usually find the same thing: MACD, RSI, Bollinger Bands, three moving averages, a stochastic oscillator, maybe a Fibonacci retracement tool nobody fully understands, all crammed onto one candlestick chart until the price action itself is barely visible. The instinct makes sense — if one indicator gives you an edge, five should give you five times the edge. That's not how it works.
Most popular indicators are built from the same raw ingredient: price (and sometimes volume). RSI, MACD, and stochastics are all, at their core, different math run on the same closing prices. Stacking them doesn't give you five independent opinions — it gives you one opinion measured five slightly different ways, and those five measurements will inevitably disagree at the edges. RSI says momentum is fading while MACD hasn't crossed yet. Stochastics say overbought while price is still climbing. None of that is a system malfunctioning — it's just what happens when you ask redundant tools slightly different questions and expect a clean answer.
The result is analysis paralysis: you stare at a chart with six signals, three lean bullish, two lean bearish, one is ambiguous, and you either freeze or you cherry-pick whichever one already agrees with what you wanted to do anyway. That second failure mode is the more dangerous one. The fix isn't finding the "best" indicator to add — it's cutting down to a small set that each measure something genuinely different (trend, momentum, participation) and only acting when they line up.
Moving average crossover: confirming the trend
A moving average smooths out daily noise so you can see the underlying trend without every red candle making you second-guess yourself. The crossover version — watching a shorter-term average like the 20-day cross above a longer-term average like the 50-day — is a simple, widely-used way to flag that the trend itself may be shifting, not just that price ticked up for a day.
When the 20-day moving average crosses above the 50-day, it means recent price action has pulled the shorter average up through the longer one — buyers have been more aggressive lately than the last couple months of trading would suggest. That's a trend-confirmation signal, not an entry trigger on its own. Crossovers lag by nature; the stock has already moved before the lines cross. Its job in your toolkit is narrow and specific: confirm that the broader trend has turned bullish, so you're not trying to swing-trade against it.
RSI as a momentum filter, not an extreme-reading gauge
RSI (Relative Strength Index) gets taught to beginners almost exclusively as an overbought/oversold tool — above 70 means sell, below 30 means buy. For swing setups on trending stocks, that framing causes more harm than good, because a strong stock can sit above 70 for weeks while it runs, and treating that as a sell signal means fading a trend that's working.
The more useful read for swing trading is simpler: is RSI holding above 50 or below 50? Above 50 generally suggests momentum favors the bulls — the average of recent up moves is outweighing the average of recent down moves. Below 50 suggests the opposite. Used this way, RSI isn't predicting a reversal, it's confirming that momentum backs up whatever the trend indicator already told you. It's a second, independent-enough angle on the same underlying question: is this move being backed by actual buying pressure, not just a couple of green candles.
Volume: the confirmation layer most beginners skip
Volume doesn't get skipped because it's complicated — it's arguably the simplest data point on the chart. It gets skipped because it's not exciting. There's no oscillator to watch bounce around, no crossing lines, just a bar chart at the bottom most platforms shrink down to a sliver. That's a mistake, because volume answers a question price and momentum indicators can't: how many people actually showed up to participate in this move.
A moving average crossover or a breakout above resistance that happens on light volume — noticeably below the stock's recent average — is a weaker signal. It could be legitimate accumulation starting quietly, or it could be a handful of trades pushing a thinly-traded stock around with nothing behind it. The same exact crossover on volume running well above average tells you a much larger, more diverse group of market participants agreed on the direction that day. Same chart pattern, very different conviction behind it.
Worked example:
A stock has been consolidating in the mid-$20s to high-$20s for a couple of months. Then:
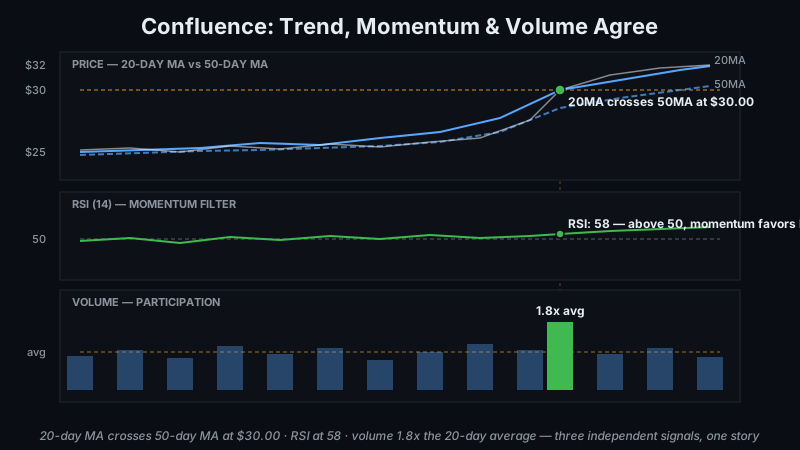
Trend: the 20-day moving average crosses above the 50-day moving average at $30.00 — first trend-confirmation signal.
Momentum: RSI is sitting at 58, comfortably above the 50 line — momentum favors the bulls, not stretched into extreme territory.
Participation: volume on the crossover day runs 1.8x the 20-day average volume — meaningfully more traders showed up than on a typical day.
None of these three signals is impressive alone. A crossover happens constantly and most fizzle. An RSI reading of 58 by itself tells you almost nothing. A single high-volume day without context could just be news noise. But stacked together — trend turning, momentum backing it, and volume confirming real participation — you have three independent measurements agreeing on the same story at the same moment. That's a meaningfully higher-quality setup than any one of them flashing in isolation, because it's much harder for three unrelated data sources to all be wrong the same way at once.
Now flip one piece: same $30.00 crossover, same RSI at 58, but volume on the crossover day comes in at 0.6x the 20-day average — well below normal. That's the setup to treat with more skepticism. The trend line crossed and momentum looks fine, but almost nobody showed up to actually trade it. A crossover without volume behind it is far more likely to be noise or a false start than a move with real conviction.
How GenZTrade helps you find these setups
Doing this confirmation check manually across a full watchlist every day doesn't scale, which is exactly the gap GenZTrade's Swing Watchlist is built to close. It runs on a 4-gate confirmation concept — a setup doesn't surface to you unless multiple independent signals agree, the same discipline as the worked example above, applied automatically instead of eyeballed one stock at a time. That keeps you from doing the thing indicator overload tempts everyone into: acting on one flashing signal because it's the one you happened to notice first.
For the volume layer specifically, High Volume Points flags days where a stock's volume breaks meaningfully above its normal range, so you can quickly check whether a crossover or breakout you're looking at actually had participation behind it, or whether it's the light-volume version worth a second look before you commit size to it.
Bottom line
No combination of indicators predicts what a stock does next. Trend, momentum, and volume are all backward-looking measurements of what already happened — they don't see the future any better stacked together than they do apart. What confluence actually buys you is narrower and more honest: it filters out a meaningful chunk of low-quality setups before you risk money on them, because a signal three independent measurements agree on is less likely to be noise than a signal only one of them is showing. That's the whole benefit. It reduces noise. It does not eliminate risk, and treating a well-confirmed setup as a sure thing is its own way of losing money.
Comments (0)