
In one sentence: Gamma exposure (GEX) estimates how much stock dealers will need to buy or sell as the market moves, and whether that hedging flow is likely to calm price action down or accelerate it.
If you have spent any time on trading Twitter or in options Discords, you have seen charts labeled "GEX" with big green and red bars stacked around a price level. A lot of traders repeat the terms "positive gamma" and "negative gamma" without ever being told what is actually happening underneath. This article breaks down the mechanism itself, not just the vocabulary.
The mechanism, in plain English
Every time a retail or institutional trader buys or sells an option, there is someone on the other side of that trade. Very often, that someone is a market maker - a dealer whose job is to provide liquidity, not to make a directional bet. Dealers do not want to be exposed to the direction of the stock, so they hedge. If a dealer sells a call option, they typically buy some amount of the underlying stock to offset the risk that the stock rallies against them.
Here is the part that matters: the amount of stock a dealer needs to hold to stay hedged is not fixed. It changes as the underlying price moves, because the option's sensitivity to price (its "delta") changes too. The rate at which that hedge needs to change is gamma. Gamma exposure, in aggregate across all the open options on a stock or index, tells you roughly how much MORE buying or selling dealers will need to do as price moves in a given direction. It is not a prediction of price - it is an estimate of forced hedging flow layered on top of whatever price does.
Positive gamma: dealers dampen moves
When dealers are collectively net long gamma - a common condition when there is heavy open interest in options that are out-of-the-money relative to the current price - their hedging tends to run counter to the trend. As the stock rises, they sell shares to stay hedged. As it falls, they buy shares back. That selling-into-strength and buying-into-weakness pattern acts like a shock absorber.
This is a big part of why some stocks or indexes go through stretches where price seems to "pin" near a level and trade in an unusually tight range for days. The dealer hedging flow is working against whatever move is trying to happen, so moves that would otherwise run further tend to stall out instead.
Negative gamma: dealers amplify moves
When dealers are collectively net short gamma, the hedging flow flips direction relative to the trend. As the stock falls, dealers need to sell more shares to stay hedged, which adds to the selling pressure that is already pushing price down. As the stock rises, they need to buy more shares, which adds to the buying pressure pushing price up.
This is a large part of why certain fast, sharp moves - selloffs in particular, but rallies too - seem to accelerate once a key level breaks. The hedging flow is not just reacting to the move anymore, it is becoming part of the move. That is the mechanical explanation behind a lot of the "waterfall" or "melt-up" price action that seems to come out of nowhere once a level gives way.
A simplified illustrative example
The numbers below are a simplified, illustrative setup meant to show the concept clearly - not a precise real-world calculation, which would require modeling every strike, expiration, and dealer positioning assumption.
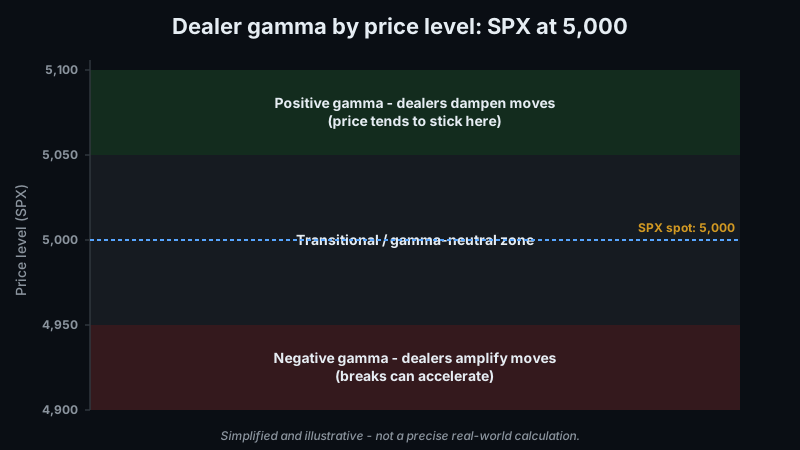
Spot price: SPX at 5,000
Below 4,950: Large put open interest concentration; dealers estimated net short gamma
Above 5,050: Heavy call open interest concentration; dealers estimated net long gamma
4,950 - 5,050 zone: Loosely described as "gamma-neutral" or transitional
In this simplified picture, above 5,050 dealer hedging tends to dampen upside moves, so price often "sticks" near that zone rather than running away. Below 4,950, the character flips - dealer hedging can accelerate downside moves, so a break below that level has more room to run, because the stabilizing flow disappears and can turn into amplifying flow instead. The 4,950 to 5,050 range in between is often treated as a transitional zone where the effect is weaker and less predictable, since it is not clearly dominated by either regime.
What GEX is NOT
GEX is not a guarantee of support or resistance. It is a probabilistic tendency based on aggregate dealer positioning, and that positioning changes daily as new options are opened, closed, and expire. A level that looked like a strong gamma wall on Monday can look completely different by Thursday once open interest shifts. No single GEX read should ever be the sole reason for taking a trade.
It is also worth being clear that GEX does not tell you direction on its own. It tells you about the character of likely price action at a given level - sticky and range-bound versus prone to accelerate - which is a fundamentally different thing than a directional signal. GEX can suggest that a move down would likely be sharp if it happens, without telling you whether that move is going to happen at all.
How to actually use it
Treat GEX levels as one more layer of context, not a standalone signal. Line it up against technical support and resistance, the prevailing trend, and whatever other information you already use to make decisions. A GEX level that coincides with an existing technical level - a prior swing high, a moving average, a well-tested support zone - is a far more meaningful confluence than a GEX level sitting in the middle of nowhere with no other technical reason for price to react there.
In practice, that means GEX works best as a filter for how you might expect a move to behave, not as an entry trigger by itself. If price is approaching a level with both technical significance and a heavy gamma concentration, that is worth paying more attention to than either signal in isolation.
How GenZTrade helps you find these setups
Reading gamma exposure has traditionally meant paying for a dedicated options-flow subscription just to see where dealer positioning is concentrated. GenZTrade computes GEX internally and surfaces those gamma exposure levels directly in the platform, so you can see where dealer positioning is concentrated without maintaining a separate specialized subscription on top of everything else.
What makes this more useful in practice is pairing it with High Volume Points, which mark where a large amount of trading activity has historically occurred at a given price. When a computed GEX level lines up with a High Volume Point, that is a real confluence worth paying attention to - two independent signals agreeing on the same zone, rather than one number in isolation. To be clear, this is a way to see computed GEX levels and check them against real technical structure, not an options-flow-prediction engine that tells you what will happen next.
Bottom line
Gamma exposure is a genuinely useful lens for understanding why price sometimes grinds sideways and sometimes accelerates violently through a level - it comes down to whether dealer hedging is working with the move or against it. But GEX is a probabilistic read on aggregate positioning that shifts daily, not a precise predictive tool, and it does not tell you direction by itself. Used as one layer of context alongside real technical levels, it can sharpen how you think about risk around a move. Used as a standalone signal, it will mislead you just as often as it helps.
Comments (0)