
In one sentence: a good growth stock isn't the one with the biggest revenue number on a screenshot — it's the one whose growth is getting cheaper to produce, not more expensive.
The headline growth number is the least useful number
Every growth-stock pitch you've seen online leads with the same thing: a revenue growth percentage, usually a big one. "Up 80% year-over-year" sounds like the whole story. It isn't even close to the whole story. Revenue growth tells you a company is selling more stuff. It tells you nothing about whether that growth is being bought at a reasonable price, whether it's sustainable, or whether the people running the company are quietly giving away pieces of it to fund the number you're staring at.
This matters more for younger, smaller accounts than almost anyone else, because you're the exact audience this kind of headline is built for. A big scary-fast growth number is engineered to grab attention on a timeline. It is not engineered to tell you whether the business is actually improving. Those are two different questions, and conflating them is how people end up holding a stock that grew revenue impressively for two years while quietly destroying value the entire time.
What actually belongs on your checklist
If you're going to evaluate a growth stock seriously, there are four things worth checking before you care about the headline number at all.
Revenue growth rate — but the trend, not the snapshot. Is growth accelerating or decelerating? A company growing 30% this year after growing 25% last year is telling you demand is building. A company growing 30% this year after growing 60% last year is decelerating, even though 30% still sounds great in isolation. The direction matters more than the single data point.
Margin trend. This is the one most new investors skip entirely, and it's arguably the most important. If gross margins are expanding as the company scales, that means each additional dollar of revenue is getting more profitable to produce — the business has real operating leverage. If margins are compressing while revenue grows, the company is spending more (on discounts, on customer acquisition, on infrastructure, on labor) for each new dollar of sales. That's growth getting more expensive, not less, and it's a pattern that eventually runs out of road.
Share dilution. Growth companies often fund expansion by issuing new stock — through employee compensation, secondary offerings, or convertible debt that turns into equity. Every new share issued is a small haircut to what you already own. A company diluting shareholders by 1-3% a year is manageable and common. A company diluting by 10%+ a year means your ownership stake is shrinking substantially every year even if the stock price holds flat, and the reported growth numbers don't reflect that hidden cost to you specifically.
Total addressable market. Growth rates that look identical on a chart mean very different things depending on how much room is left to run. A company growing 35% a year with a market that's 5% penetrated has a much longer runway than a company growing 35% a year in a market it already dominates. Ask what percentage of the realistic total market the company has already captured, because growth has to slow down eventually once that number gets high.
A worked comparison
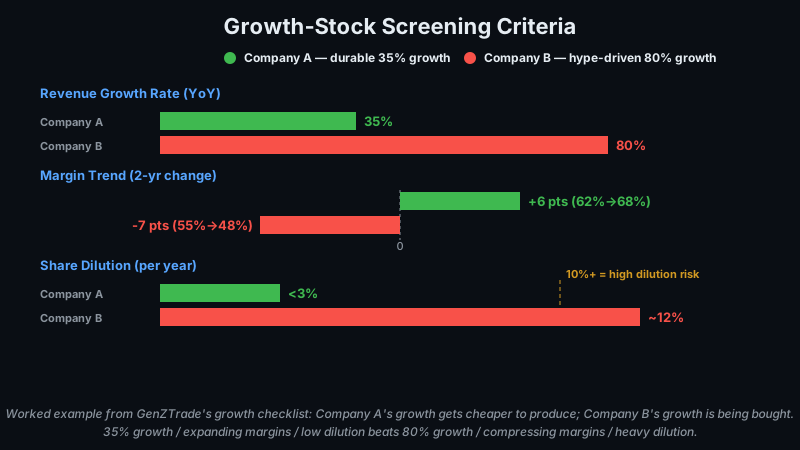
Here's how this plays out with two hypothetical companies. Neither of these is real — they're built purely to illustrate how the checklist changes the read on a stock.
Company A
Revenue growth: 35% year-over-year
Gross margin: expanding from 62% to 68% over 2 years
Share dilution: under 3% per year
Company B
Revenue growth: 80% year-over-year
Gross margin: compressing from 55% to 48% over 2 years
Share dilution: around 12% per year
On the headline number alone, Company B looks like the obvious pick. 80% growth versus 35% growth isn't close. But look at what's underneath each number. Company A's margins expanded six points in two years — meaning every incremental dollar of revenue is now more profitable than it used to be, which is exactly what you want to see as a growth business scales. And Company A is funding that growth while diluting existing shareholders by less than 3% a year, so the growth in the business is actually showing up as growth in what you own.
Company B's growth is real, but it's being bought. Margins compressed seven points in two years, meaning the company is spending progressively more — on discounting, on acquiring customers, on whatever is driving that top-line number — for each dollar of revenue it adds. At the same time, it's issuing roughly 12% new shares a year to keep the lights on and the growth engine running. Run that dilution forward: over just three years, a shareholder in Company B could see their ownership stake shrink by roughly a third, even if the stock price stays flat, purely from new shares being issued. Company A's shareholders lose a fraction of that.
The 35% grower with expanding margins and minimal dilution is, on this evidence, the more durable business. The 80% grower is putting up a flashier number, but a meaningful chunk of that growth is being paid for by making the underlying business less profitable per dollar of sales and by handing out a large slice of the company to new shareholders every year. That's not automatically disqualifying — some businesses genuinely need to spend heavily early to win a market — but it's a materially different risk profile than the headline suggests, and it's exactly the kind of thing that gets lost when all you see is "80% growth" in a social media post.
How GenZTrade helps you find these setups
Checking revenue trends, margin direction, dilution, and market size by hand for every stock someone hypes up is a lot of work, and most people skip it — which is exactly why hype outruns fundamentals so often. Spotlight is built to surface names worth a closer look instead of leaving you to sort through whatever's trending. The Long Growth feature goes a step further for this specific use case: it prescreens growth candidates against criteria like the ones above — growth trend direction, margin trajectory, and dilution — so you're starting from a shortlist that's already been filtered on substance, not on how many people are posting about it this week. It doesn't replace doing your own reading. It just means you're not starting from zero every time a new "next big thing" shows up in your feed.
Bottom line
None of this is a formula that guarantees a winning pick. A company can check every box on this list — accelerating growth, expanding margins, low dilution, a huge addressable market — and still get hit by a recession, a new competitor, a leadership misstep, or a market that shifts underneath it. Execution risk doesn't go away just because the numbers look clean on a spreadsheet, and past growth trends are a description of what already happened, not a promise about what happens next. What this checklist actually does is filter out the growth stories that are hollow before you put money into them, and force you to notice the cost side of growth that a headline number is specifically designed to hide. That's a meaningfully better starting point than picking based on which stock is loudest online, even if it isn't a guarantee.
Comments (0)