
In one sentence: An options chain is just a table of every strike price and expiration date available for a stock, and once you know what each column means, it stops looking like noise.
What an options chain actually is
An options chain is a list of every available strike price and expiration date for a stock's options, with live pricing and trading data attached to each one. Open any broker's options screen and you'll see calls listed on one side and puts on the other, usually with the current stock price highlighted in the middle so you can quickly tell which strikes are in the money and which are out of the money.
Pick an expiration date at the top of the screen and the chain reloads to show every strike available for that date. Pick a different expiration and the whole table changes again. That's the two-dimensional nature of an options chain - strike price on one axis, expiration date on the other, and a full set of live data points at every intersection.
The columns, one at a time
Strike Price
The strike price is the price at which the option can be exercised. A $150 call gives the holder the right to buy the stock at $150, no matter where the stock is actually trading. Every row in the chain represents a different strike.
Bid
The bid is the highest price a buyer is currently willing to pay for that option. If you want to sell right now, the bid is roughly what you'd get.
Ask
The ask is the lowest price a seller is currently willing to accept. If you want to buy right now, the ask is roughly what you'd pay. The gap between the bid and the ask is called the bid-ask spread, and a wide spread is a warning sign of poor liquidity - it means there's a real cost to getting in and out of that specific option.
Last
Last is the price of the most recent trade that actually went through. It's tempting to treat this as "the price," but on a strike that hasn't traded in a while, Last can be stale by minutes or even hours. The bid and ask are what you can actually transact at right now.
Volume
Volume is how many contracts of that specific option have traded today. It resets to zero every morning. Higher volume generally means more active trading and tighter spreads.
Open Interest
Open interest is how many contracts are currently outstanding - opened and not yet closed - across all traders, going back further than just today. It's a rough measure of how much ongoing interest exists in that strike, separate from how busy it's been today specifically.
Implied Volatility (IV)
Implied volatility is the market's expectation of how much the stock will swing before expiration, baked directly into the option's price. Higher IV means a more expensive option, all else equal, because the market is pricing in more uncertainty.
Delta
Delta does two jobs at once. It's a rough proxy for the probability that an option finishes in the money, and it also tells you how much the option's price should move for every $1 move in the stock. A delta of 0.50 means roughly a 50/50 shot of finishing in the money, and roughly a $0.50 move in the option for every $1 move in the stock.
A real example chain
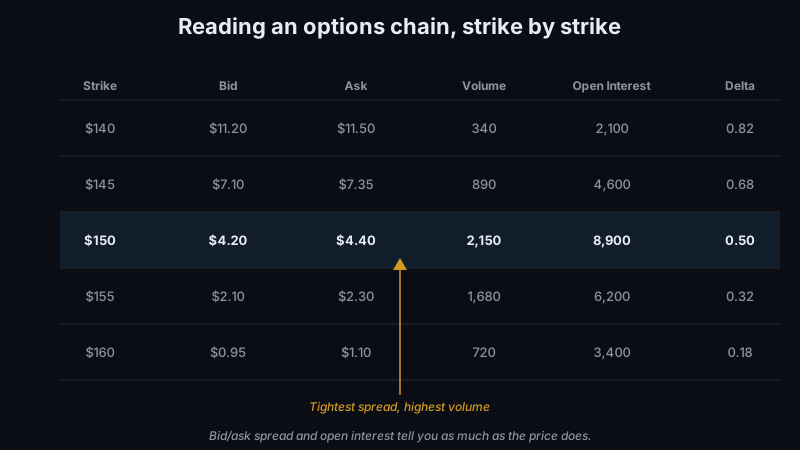
Here's a simplified call option chain for a stock trading at $150, all for the same expiration date.
| Strike | Bid | Ask | Volume | Open Interest | Delta |
|---|---|---|---|---|---|
| $140 | $11.20 | $11.50 | 340 | 2,100 | 0.82 |
| $145 | $7.10 | $7.35 | 890 | 4,600 | 0.68 |
| $150 | $4.20 | $4.40 | 2,150 | 8,900 | 0.50 |
| $155 | $2.10 | $2.30 | 1,680 | 6,200 | 0.32 |
| $160 | $0.95 | $1.10 | 720 | 3,400 | 0.18 |
Reading the example
The $150 strike is at the money - the strike sits right at the current stock price - and it's the clear liquidity winner in this chain. It has the tightest relative spread ($4.20 to $4.40, a small slice of the option's value), the highest volume at 2,150 contracts, and the highest open interest at 8,900. That combination makes it the easiest strike in the chain to get in and out of without losing much to the spread.
The $160 strike tells a different story. The dollar spread looks small at $0.15, but on an option worth somewhere between $0.95 and $1.10, that $0.15 is over 14 percent of the option's value. Combined with lower volume and lower open interest than the strikes closer to the money, that $160 strike carries real slippage risk even though the sticker price looks like a bargain.
Delta moves the way you'd expect as you scan down the table: 0.82 at $140, sliding down to 0.18 at $160. That drop matches simple probability intuition - the further out of the money a strike sits, the lower the odds it finishes there, and the smaller its price reaction to a $1 move in the stock.
Common beginner mistakes reading a chain
The first mistake is treating Last as the current price. Last is just the most recent trade, and on a strike that hasn't seen activity in a while, it can be minutes or hours old. The bid and ask are what actually reflect where you could trade right now - always check those before assuming you know the price.
The second mistake is ignoring open interest entirely. Buying an option that almost nobody else holds can leave you stuck when you try to exit, since there may not be another trader on the other side of your sell order. Low open interest is a quiet signal that liquidity could dry up right when you need it.
The third mistake is chasing strikes that "look cheap" in dollar terms without checking the spread as a percentage of the price. A $1.00 option with a $0.15 spread is a much worse trade, mechanically, than a $4.30 option with a $0.20 spread, even though the first one has the smaller sticker price. Always eyeball the spread relative to the premium, not just the premium on its own.
How GenZTrade helps you find these setups
Scanning a full options chain strike by strike, for every stock you're watching, gets old fast - and it's easy to miss the liquidity details that actually matter. Options Plays on GenZTrade surfaces pre-filtered, pre-scored strikes so you're not manually scanning an entire chain every time you want to check a trade. And before you even open a chain, the Momentum Scanner helps narrow the universe of stocks worth looking at in the first place, so you're spending your chain-reading time on names that are actually moving.
Bottom line
An options chain isn't actually complicated once you know what each column is telling you - strike sets the terms, bid and ask set the real tradeable price, volume and open interest tell you how liquid a strike is, and IV and delta tell you how the market is pricing risk and probability. None of that tells you what will happen next, and no column in a chain can promise a winning trade. But learning to read one properly means you're making decisions based on what's actually there, instead of guessing at a wall of numbers.
Comments (0)