
In one sentence: unusual options activity is a useful clue about where big money might be positioning, but only after you filter out the hedges, rolls, and routine noise that make up most of it.
What "unusual options activity" actually means
Unusual options activity, usually shortened to UOA, refers to trading volume on a specific strike and expiration that is dramatically higher than what that contract normally sees. The comparison point traders lean on most is open interest - the total number of contracts for that strike and expiration that are currently outstanding, meaning still open and not yet closed or expired.
The logic is straightforward. Open interest represents everything that already exists for that contract. If the volume traded in a single session starts to rival or exceed that existing pool, it's a decent sign that new positions are being opened rather than existing ones simply changing hands between traders who already held them. That distinction matters. A contract can trade a lot of volume just from existing holders trading with each other, and that tells you almost nothing about new conviction entering the market.
The math behind "unusual"
The most common way traders quantify this is the volume-to-open-interest ratio, sometimes written as volume/OI. You take the day's contract volume and divide it by the open interest going into that session. Here's a real example of how the numbers work.
Contract: $50 call, expiring in three weeks
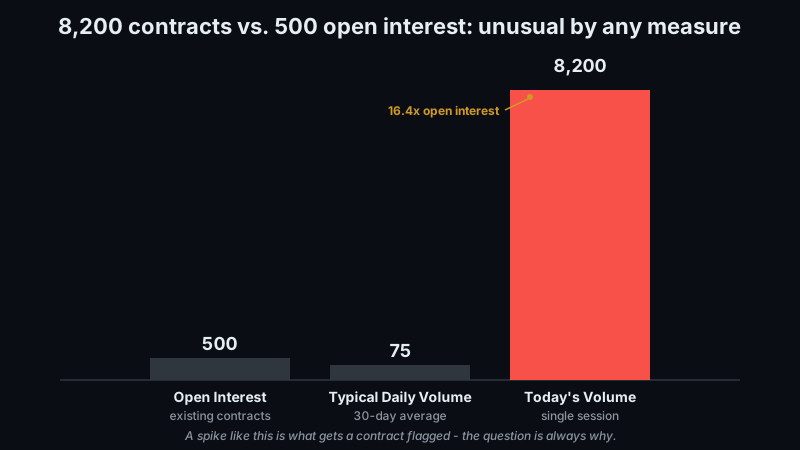
Normal open interest: 500 contracts
Typical daily volume: 50-100 contracts
Today's volume: 8,200 contracts
Volume/OI ratio today: 8,200 / 500 = 16.4x
Volume/OI ratio on a normal day: 100 / 500 = 0.2x
On a quiet day, that contract trades at roughly a fifth of its open interest. Today it traded more than 16 times its open interest in a single session. Many traders use 1.0x as a rough line in the sand - a ratio above 1.0x means volume for the day exceeded the entire existing pool of open contracts, which is already notable. A ratio of 16.4x is far past that threshold and is exactly the kind of number that trips scanners and gets a ticker flagged as having unusual activity.
The math is simple. What's not simple is figuring out what that spike actually means, which is where most people get faked out.
Sweep vs. block: two different signals
Not all large options trades are built the same way, and the structure of the trade tells you something about the intent behind it.
Sweeps
A sweep is a large order that gets broken into smaller pieces and routed across multiple exchanges at the same time, so the whole position fills almost instantly. Sweeps are generally read as a sign of urgency. The trader wasn't willing to wait for a better price or let a limit order sit - they wanted the position filled now, even if that meant paying up through several price levels to get it done. That urgency is part of why sweeps get so much attention on flow scanners. It suggests someone believed the window to get in was closing.
Blocks
A block trade is a large single trade, often negotiated directly between parties rather than swept across the open market. Blocks are harder to read. A block can absolutely be a directional bet, but it can just as easily be one leg of a spread, a hedge against a position held somewhere else entirely, or part of a larger institutional strategy that has nothing to do with a simple bullish or bearish view on the stock. Because you generally can't see the other side of the trade, a block by itself carries a lot more ambiguity than a sweep does.
Why most unusual activity means nothing
This is the part scanners don't tell you, and it's worth being blunt about: most of what gets flagged as unusual options activity is not a fresh directional bet. A large chunk of it comes from market maker hedging activity, existing spread positions being adjusted as the stock moves, or a fund simply rolling a large position from one expiration to a later one. None of that reflects someone putting on a brand new bet on the stock's direction - it's portfolio maintenance that happens to generate a big volume number.
A few checks help filter the noise before you take a flagged trade seriously.
Ask or bid?
Was the trade executed on the ask, meaning the buyer was aggressive enough to pay the offered price, or on the bid, which can indicate selling or writing of the option? Buying on the ask is a much more aggressive, bullish-leaning signal than a trade that printed on the bid. Selling or writing options is a completely different position with different risk than buying them outright, and scanners that just show "unusual volume" without this detail can be misleading.
Is it paired with anything?
Did the flow show up alongside a stock price move or a news catalyst, or is it standing alone with no other explanation? Flow that lines up with a breakout, an earnings date, or a headline has context. Flow that appears out of nowhere on a stock that hasn't moved and has no scheduled catalyst is harder to trust and more likely to be hedging or portfolio noise.
How far out is the expiration?
A same-week expiration trade can be a hedge, a short-term earnings play, or a quick scalp - it doesn't necessarily reflect a real thesis about the company. An expiration that's weeks or months out is more consistent with someone expressing an actual directional view, since there's more time premium at stake and less room for the trade to just be a quick tactical hedge.
How to actually use it
Unusual options activity works best as one input that needs to line up with other signals, not as a standalone signal you trade off of. A large call sweep on a stock that is also breaking out of a base on rising volume is a meaningfully stronger combined signal than the exact same sweep appearing on a stock chopping around in the middle of a boring range with no technical catalyst in sight. The flow and the chart telling the same story is what makes a setup worth paying attention to - either one on its own is much weaker.
It's also worth saying directly: following someone else's options flow blindly is not a strategy. You don't know the size of the original trader's account relative to the position, their cost basis, what else they're hedging, or their exit plan. A trade that's a reasonable, well-sized bet for a fund managing hundreds of millions of dollars could be wildly oversized or reckless for an individual account copying it dollar-for-dollar. Nothing here should be read as a signal that guarantees a particular outcome - options flow, like any other indicator, can be wrong, and it can also be right for reasons that have nothing to do with the stock going where you think it will. Any trade you take needs to fit your own risk tolerance, your own position sizing, and your own exit plan before you put it on.
How GenZTrade helps you find these setups
Manually comparing volume to open interest across every ticker on a watchlist, contract by contract, is not something most traders have time to do every day. GenZTrade's Intel Panel surfaces options flow and unusual activity alongside news sentiment for a stock in one place, so you can see whether a flagged trade is paired with a headline or a sentiment shift without digging through several separate tools.
From there, the Momentum Scanner is where you check whether the underlying's technical picture actually agrees with what the flow is suggesting - whether the stock is breaking out, consolidating, or showing no real technical case at all. Pairing what the flow says with what the chart says is the combination that matters, and that's the workflow these two tools are built to support together.
Bottom line
Unusual options activity is a real, measurable thing - volume that spikes well past a contract's open interest is genuinely worth a second look, and the math behind flagging it is simple enough to check yourself. But the label "unusual" doesn't mean "profitable" or "confirmed," and most of what triggers a scanner turns out to be hedging, rolling, or noise once you dig into how the trade was structured and whether anything else supports it. Treat flow as a clue that earns your attention, not an answer that tells you what to do, and always run it through your own filters - ask versus bid, expiration length, and whether the chart agrees - before it becomes part of your own trade plan.
Comments (0)