
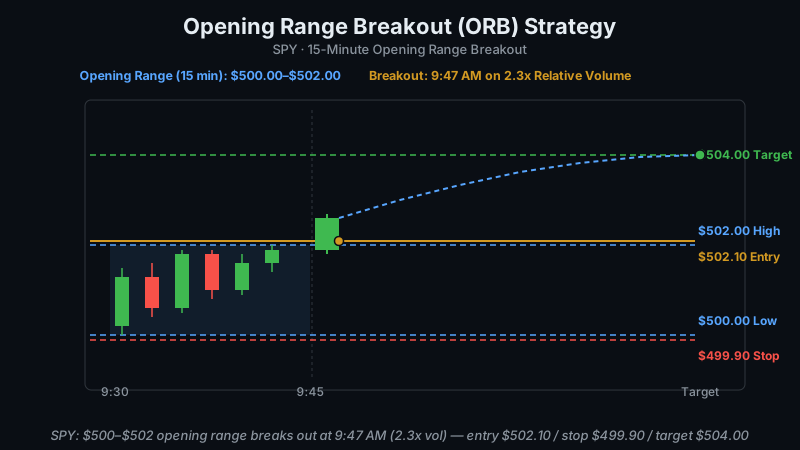
In one sentence: the opening range breakout (ORB) strategy marks the high and low of the first few minutes of the trading day, then looks for price to break out of that range on strong volume, with the range itself giving you a built-in stop and a built-in target.
What the "opening range" actually is
The opening range is just the high and low price a stock trades between during a defined window at the start of the day session. You pick the window length up front: 5 minutes, 15 minutes, or 30 minutes are the three you'll see most often. A 5-minute range is tighter and triggers faster, but it's noisier and more prone to fakeouts. A 30-minute range filters out more noise but you give up a lot of the move waiting for it to form. Fifteen minutes is the standard starting point for a reason — it's long enough to smooth out the first few minutes of chaos, short enough that you're not sitting around all morning waiting for a signal.
Why the first few minutes matter more than the rest of the day
The open is where overnight order flow — news, earnings, futures moves, gap orders sitting since yesterday's close — collides with the first wave of day-session participants actually reacting in real time. That collision produces a range that reflects genuine disagreement about where the stock should be priced. When price finally breaks out of that range, it's a signal that one side of the argument won: buyers or sellers absorbed the other side and started pushing in one direction with conviction. That's the whole premise behind ORB. You're not guessing about direction — you're waiting for the market to show you who won the first fight of the day before you commit capital.
A full worked example
Setup: SPY opens at $500.00.
Opening range (first 15 minutes): price trades between $500.00 and $502.00. That $2.00 spread is your opening range.
Breakout: at 9:47am, price pushes above $502.00 on 2.3x relative volume compared to the average for that time of day.
Entry: $502.10 — a few cents above the range high, not the instant it touches $502.00. That small buffer helps filter out a breakout that pokes above the level and immediately reverses.
Stop: $499.90 — a few cents below the range low of $500.00.
Risk per share: $502.10 − $499.90 = $2.20.
Target (measured move): range height ($2.00) added to the breakout level ($502.00) = $504.00.
Reward per share: $504.00 − $502.10 = $1.90.
Reward-to-risk: $1.90 of reward against $2.20 of risk — roughly even, not a huge edge on paper, which is normal for ORB and exactly why volume confirmation and stop discipline carry so much of the weight.
Notice the target isn't arbitrary. The measured-move logic says the range itself represents the size of the imbalance that built up during those 15 minutes, so a breakout has a reasonable shot at traveling that same distance again once it clears the level. It's not a law of physics — it's a heuristic that happens to work often enough to be worth using as a first target, with the option to trail the rest of the position if momentum keeps going.
Why volume confirmation isn't optional
A breakout above the range high on light, below-average volume is a much weaker signal than the same price move on volume that's running well above normal. Low-volume breakouts are frequently just price drifting through a level because there's nobody there to stop it — not because real buying pressure showed up. That's the setup that reverses 20 minutes later and stops out anyone who chased it. Relative volume — comparing current volume to what's typical for that stock at that specific time of day — is what separates a breakout with actual participants behind it from one that's just noise. In the example above, 2.3x relative volume at the moment of the break is doing a lot of the confirmation work; without it, the same price action means a lot less.
The most common mistake
The single biggest way people mess up ORB is jumping in the instant price touches the range high, instead of waiting for a confirmed close or hold above it. Price often tags a level, triggers a cluster of breakout orders, and then snaps right back inside the range — a classic bull trap that punishes anyone who entered on the first tick. Waiting for a candle to close above the range, or for price to hold above the level for a minute or two, costs you a little bit of entry price, but it saves you from the fakeouts that make up a meaningful share of all ORB attempts. The few cents you give up on entry is cheap insurance against the moves that go nowhere.
How GenZTrade helps you find these setups
Watching the first 15 minutes on every ticker on your watchlist, in real time, while also checking relative volume by hand, isn't realistic if you're trading a handful of names or managing a day job around your trading. GenZTrade's Momentum Scanner is built for exactly this gap — it flags ORB-style breakout setups automatically, with relative volume filtering baked into the scan itself, so you're not manually eyeballing charts trying to catch the exact moment a range breaks. Instead of splitting your attention across a dozen tabs during the most volatile 15 minutes of the day, you get a filtered list of tickers that are actually showing the volume-backed breakout behavior the ORB strategy depends on, so you can focus on execution and risk management instead of discovery.
Bottom line
Opening range breakout is a well-known, well-tested pattern — it's not some hidden edge nobody else knows about. Everyone with a charting platform can draw the same 15-minute box you can, which means the level itself gets crowded and false breakouts happen often enough that you have to plan for them, not just hope you avoid them. The setup gives you a clean, rules-based way to define entry, stop, and target, but it doesn't do your risk management for you. Respect the stop, size the position so a loss doesn't wreck your day, and treat volume confirmation as a requirement rather than a nice-to-have. The pattern gets you into the trade with a plan. Your discipline is what determines whether that plan actually protects you when the breakout fails.
Comments (0)