
In one sentence: A good options day-trading scanner is not about finding "hot" tickers - it is about filtering out everything that will get you chopped up on spreads and slippage before you ever look at direction.
Why most "top gainers" lists are a trap for options day traders
Open any free scanner and sort by percent change, and you will get a list of stocks up 5, 8, sometimes 15 percent on the day. It feels like a shortcut to opportunity. For a stock day trader, that list might actually be useful. For an options day trader, it is often a trap.
Here is the problem: a stock can move 5 percent on relatively light volume and still have a garbage options market. Wide bid-ask spreads on the contracts themselves will eat your edge before the trade even has a chance to work. You buy at the ask, the stock moves in your favor, and you still lose money on the exit because you are selling back into a spread that was never priced for a quick in-and-out trade. Day trading options needs a different filter set than day trading the underlying stock, and most scanners are not built with that distinction in mind.
The criteria that actually matter
Relative volume (RVOL)
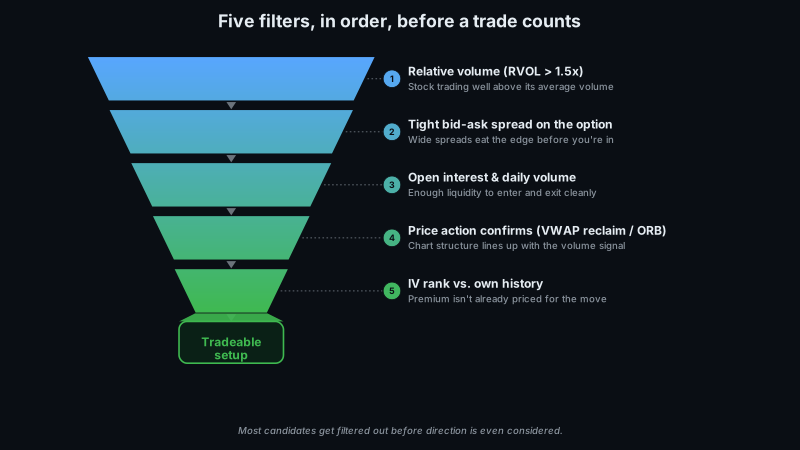
Absolute volume tells you almost nothing on its own. A stock that trades 20 million shares a day trading 20 million shares today is not unusual - it is just Tuesday. What matters is relative volume: how today's volume compares to that stock's own recent average, typically the 20 or 30-day average at the same point in the session. We look for RVOL somewhere in the 1.5x to 2x range or higher. That is the signal that something today is different from a normal day for this specific stock, not just a stock that happens to be liquid in general.
Tight bid-ask spread on the options themselves
This is the one traders skip most often, and it is arguably the most important. A stock can have excellent share liquidity - tight spreads, deep order books - and still have terrible options liquidity on a given strike or expiration. You have to check the actual options chain, not just the stock's volume. A $0.05 spread on a $1.20 option costs you roughly 4 percent round trip before the trade has moved a single cent in your favor. Multiply that across several trades a week and it is a meaningful drag on results, independent of whether your directional read was even correct.
Open interest and daily options volume
Open interest tells you how many contracts are outstanding on that strike, and daily options volume tells you how many are actually changing hands today. Low open interest is a warning sign for two reasons: you might not get filled at a fair price on entry, and more importantly, you might struggle to exit quickly when you need to intraday. Day trading options is not the place to find out your strike is illiquid after you are already in the position.
Price action confirming the setup, not just a scanner hit
A scanner hit on volume and liquidity is a filter, not a signal. We want to see price action confirm the setup on top of that - something like a VWAP reclaim after an early flush, or a clean opening range breakout with volume behind it. The point is that this confirmation sits on top of the liquidity filters, not in place of them. A great-looking breakout on a stock with a wide options spread is still a bad options trade.
Implied volatility rank relative to the stock's own history
IV rank tells you where implied volatility sits today relative to where it has typically sat for that stock over the past year or so. This matters because it changes what kind of trade makes sense. Elevated IV relative to its own history means options are pricing in more movement than usual, which can make buying premium expensive and selling premium comparatively more attractive - and vice versa when IV rank is low. Comparing a stock to its own history matters here too, the same way it does with RVOL. A stock with structurally high IV is not "elevated" just because the number looks big in isolation.
A practical example
Say a scan turns up a stock at $85. RVOL is sitting at 2.3x, meaningfully above normal for that name. The front-month, at-the-money strike has 4,200 contracts of open interest. The bid-ask spread on that option is $0.04 wide on a $1.10 option, which works out to about 3.6 percent of the option's value - tight enough that slippage is not going to be the reason the trade loses money. On the chart, the stock reclaimed VWAP after an opening range breakout, giving a confirmation trigger layered on top of everything else lining up.
Now compare that to a stock that looks more exciting on the surface: up 6 percent on the day, which reads as a bigger headline move than the $85 stock above. But look closer. RVOL is only 1.1x - that is within its normal daily range, nothing unusual is actually happening under the hood. The options spread is $0.25 wide on a $0.90 option, which is about 28 percent of the option's value. That spread alone makes the position essentially untradeable for a day trade; you would need a large, fast move just to cover the entry and exit cost before you make a dollar of profit.
The headline price move on that second stock means nothing without the underlying filters. It looks like the better trade at a glance and is actually the worse one by a wide margin once you check volume relative to normal and the actual cost of getting in and out.
Building this into a repeatable process
The value of a criteria list is not the individual filters - it is running the same filters, in the same order, every single day, rather than re-deciding what "looks good" on the fly under time pressure. Markets move fast in the first hour, and that is exactly when judgment gets sloppy. A written checklist - RVOL, then spread, then open interest and volume, then price action confirmation, then IV rank - beats a vague feel for what looks exciting on a scanner screen. It also makes your results easier to review later, because you can go back and see which filter actually mattered on the trades that worked and the ones that did not.
How GenZTrade's scanner applies this
The Momentum Scanner is built around this exact filter logic rather than a simple percent-gainers sort. It looks for VWAP reclaims, opening range breakouts, and volume conditions that are unusual relative to a stock's own history - the same RVOL logic described above, not just raw volume in absolute terms. That gives you a shortlist of candidates that have already cleared the first, most important filters.
From there, Options Plays takes candidates that pass the scanner and layers strikes, credit, break-even, and probability on top, so you are not manually pulling up an options chain for every name on the list to check spreads and open interest by hand. The scanner narrows the universe; Options Plays turns the survivors into an actual, structured trade to evaluate.
Bottom line
An options scanner for day trading is only as good as what it filters out. Chasing the biggest percentage movers without checking relative volume, options spread, open interest, and confirming price action is how traders end up losing money to slippage on trades that were directionally correct. Build the checklist, run it in the same order every day, and let the setups that survive it - not the ones that just look exciting on a headline - be the ones you actually trade.
Comments (0)