
In one sentence: Relative volume tells you whether the volume behind a price move is actually unusual for that stock at that exact point in the trading day, or whether you're just looking at normal noise dressed up as a breakout.
What RVOL actually measures
Most new traders look at a volume bar on a chart and think "big bar, big deal." That's not wrong, exactly, but it's incomplete. A volume number by itself has no context. Is 800,000 shares a lot? Depends entirely on what that stock normally does.
Relative volume, or RVOL, fixes that by comparing today's volume to the stock's own history. Specifically, a proper RVOL reading compares today's volume-so-far to the average volume that stock has traded by that same time of day, over roughly the last 20 trading days.
That "same time of day" part is the piece people skip, and it's the whole point. If you compare 10:00am volume today to a full day's average volume, you'll always look under-volumed at 10:00am, because a full trading day hasn't happened yet. That's not a signal, that's just math working against you. RVOL solves this by building a time-of-day baseline: what does this stock typically do by 10:00am, by 11:00am, by 1:00pm, based on the recent 20 days. Then it measures today against that specific baseline, not against the finish line of a race that isn't over yet.
A worked example
Here's how the math actually plays out.
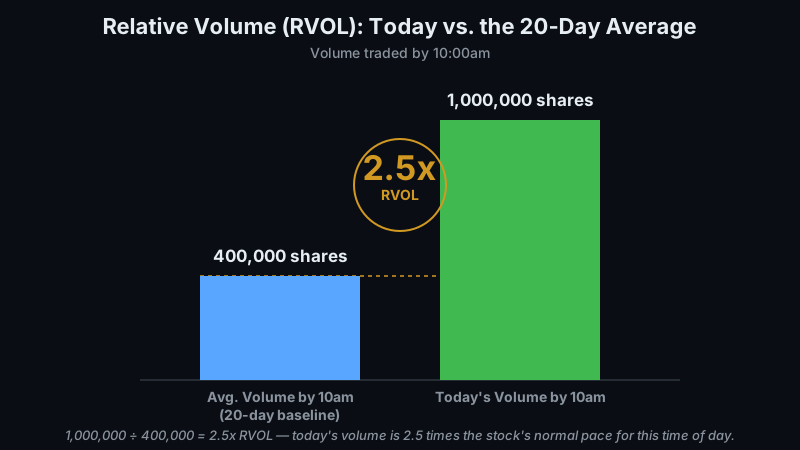
Average volume by 10:00am (last 20 trading days): 400,000 shares
Today's volume by 10:00am: 1,000,000 shares
RVOL calculation: 1,000,000 ÷ 400,000 = 2.5x
What that means: By 10:00am, this stock has already traded two and a half times its normal volume for that point in the session.
An RVOL of 2.5x is a real signal. It means something changed. More people than usual are trading this stock, right now, this early in the day. If that stock is also breaking out to a new high on that volume, you're looking at a move with actual participation behind it — real buyers stepping in, not just a handful of algos nudging the price around on thin activity.
Now picture the exact same chart pattern, the exact same breakout level, the exact same percentage gain, except today's volume by 10:00am is only 320,000 shares against that same 400,000 average. That's an RVOL of 0.8x — below normal.
A breakout on 0.8x RVOL should make you skeptical, not excited. The price cleared the level, sure, but almost nobody showed up to do it. There isn't enough participation behind the move to defend it. These are the breakouts that tend to stall, get sold into, or reverse hard the moment even a small wave of selling shows up, because there was never a crowd behind the buy side to begin with. Same chart pattern, completely different level of conviction. If you only look at price, you'd treat these two setups identically. If you check RVOL, you wouldn't.
Why RVOL beats the raw volume number
This is the part that trips people up when they're new: a big volume number isn't automatically meaningful, and a "small" one isn't automatically boring. It depends entirely on the stock.
A stock that normally trades 5 million shares a day showing up with 6 million today is barely a blip — that's roughly 1.2x RVOL, well within normal variation. Nobody should be excited about that.
But a stock that normally trades a quiet 200,000 shares a day suddenly printing 1 million shares is a completely different story. That's 5x its normal volume. Something is happening — news, a filing, a short squeeze building, real accumulation. The raw number, 1 million shares, sounds small compared to the first example's 6 million. But relative to that stock's normal behavior, it's the far more significant event. RVOL is what lets you compare across completely different stocks on an apples-to-apples basis instead of anchoring on whichever number looks biggest.
How GenZTrade helps you find these setups
Doing this math by hand, for every ticker, every day, isn't realistic — and it's exactly the kind of repetitive work that should be automated instead of eyeballed. GenZTrade's Momentum Scanner filters the market for you by elevated RVOL directly, so instead of manually pulling up 20-day time-of-day averages for a watchlist of thirty stocks, you get a filtered list of names already showing unusual participation right now.
Once you've got a name worth looking at, High Volume Points shows you where the real volume-driven support and resistance levels actually sit on the chart — the price zones where meaningful volume has previously changed hands, not just arbitrary round numbers or lines someone eyeballed. Pairing the two means you're not just seeing that a stock is moving on high RVOL, you're seeing exactly where on the chart that volume has mattered before, which is a much better way to judge whether a breakout has room to run or is about to run into a wall of prior supply.
Bottom line
RVOL is a participation gauge, not a crystal ball. High relative volume tells you a move has real interest behind it — that it isn't just drift or noise. It does not tell you which direction is "right," and it won't save you from a bad thesis. A stock can have massive RVOL and still be the wrong trade. What RVOL gives you is confirmation that whatever is happening on the chart is actually happening, with real people behind it, instead of being a mirage you'd only catch by checking the volume against history first.
Comments (0)