
In one sentence: VWAP is the volume-weighted average price every share of a stock has traded at since the market opened, and whether price holds above or below it tells you who's actually in control — buyers or sellers.
What VWAP actually is (it's not a moving average)
VWAP stands for volume-weighted average price, and the "volume-weighted" part is the whole point. A simple moving average just averages price over time — the last 20 candles, equally weighted, no matter how many shares changed hands on each one. VWAP averages price by volume instead. If 2 million shares traded at $50 and 200,000 shares traded at $52, VWAP leans hard toward $50, because that's where most of the actual money moved. A candle with almost no volume barely nudges VWAP at all.
VWAP also resets every session. It starts calculating fresh at the open and accumulates through the day, so it isn't a lagging indicator carried over from yesterday — it's a running answer to the question "what has every dollar traded today actually paid, on average?" That's exactly why institutions use it as a benchmark. A fund trying to buy 500,000 shares without moving the market will often measure its own execution against VWAP: if they bought below VWAP on average, they got a good fill relative to the rest of the day's activity. It's less a trading signal by design and more a fairness yardstick that traders later repurposed as a signal.
Why holding above VWAP all session actually means something
When a stock trades above VWAP for most of the session, it means buyers have been willing to keep paying more than the day's volume-weighted average price — not just at the open, but repeatedly, as the average itself climbs. That's a real tell. It takes sustained demand to keep price above a rising benchmark, because VWAP itself is being pulled up by the same buying that's happening. Sellers aren't able to push price back down to the "fair" average, which suggests they're outnumbered or unwilling to sell at a discount.
The reverse is just as telling. A stock stuck below VWAP all day means sellers keep getting filled at prices under the average — every bounce gets sold into before it can reclaim that line. It doesn't necessarily mean a stock is doomed, but it does mean sellers currently have the upper hand, and buyers trying to catch a bottom below VWAP are fighting the session's own trend, not riding it.
A worked example: VWAP reclaim vs. VWAP breakdown
The two setups traders actually watch for are opposites of each other. Here's how a clean reclaim looks in practice.
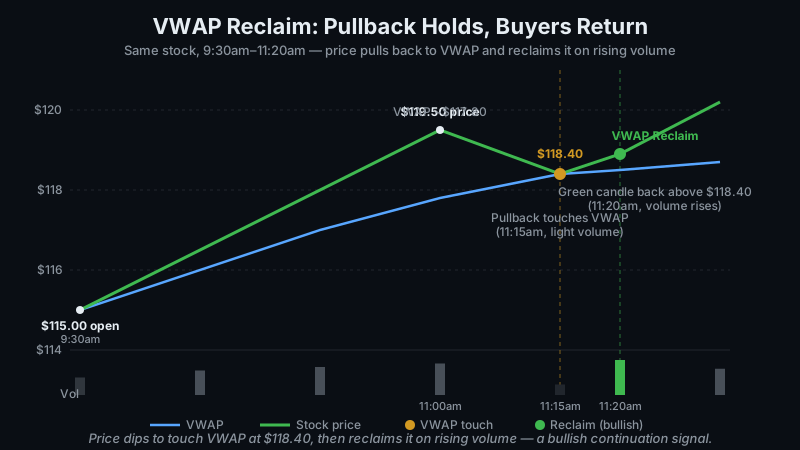
9:30am–11:00am: Stock opens at $115.00 and trends higher on steady volume, staying above VWAP the entire morning. By 11:00am, VWAP has climbed to roughly $117.80 as price trades near $119.50.
11:15am: Price pulls back and touches VWAP at $118.40. Volume on the pullback candles is noticeably lighter than the volume that drove the morning rally — a sign sellers aren't pressing, just that momentum paused.
11:20am: Price prints a green candle back above $118.40, and volume picks back up above the recent average as it does. This is the VWAP reclaim — price touched the average, didn't break down through it, and buyers stepped back in with real volume behind them.
Why this matters: Traders who use VWAP treat this as a continuation signal, not a new idea. The trend was already up; the reclaim just confirms the pullback was healthy instead of the start of a breakdown.
The opposite case — VWAP breakdown: Same stock, different day. Price has been chopping around VWAP all morning, then closes a 15-minute candle below VWAP on volume that's above the session's average. That's a VWAP breakdown — sellers didn't just dip below the line, they did it with conviction behind them. For anyone long the stock, that's read as a warning sign, not a buying opportunity.
The catch is that a reclaim and a breakdown can look similar for the first few minutes, and telling them apart in real time is the actual skill. A healthy pullback touches VWAP, holds, and reclaims on rising volume within a candle or two — like the $118.40 example above. A slow breakdown looks different: price grinds below VWAP, tries to reclaim it, fails, tries again, fails again, each attempt weaker than the last. That repeated failure to reclaim — not the first touch — is the real tell that control has shifted to sellers. Treating every single touch of VWAP as an automatic buy signal is how traders get chopped up in exactly this kind of grind.
How GenZTrade helps you find these setups
Spotting a VWAP reclaim manually means watching a chart in real time and catching the exact moment price crosses back over the line with volume to back it up — easy to miss if you're not staring at the screen. The Momentum Scanner includes VWAP-based filters so you can surface stocks trading above VWAP with strength already building, instead of scanning tickers one at a time hoping to catch the reclaim as it happens.
Volume is the part that separates a real reclaim from a stock just drifting back over the line on nothing. High Volume Points flags where volume is actually elevated relative to normal, so you're not trusting your eyes to judge whether that reclaim candle's volume was meaningful or just average. Pairing a VWAP-based scan with volume confirmation is the difference between reacting to a price touch and reacting to an actual shift in who's in control.
Bottom line
VWAP is a real, widely-used reference level — institutions build execution benchmarks around it, and enough traders watch it that reactions around it can become somewhat self-fulfilling. That's exactly why it's worth knowing. But it isn't a magic signal on its own. Price touching VWAP tells you nothing by itself; what matters is what volume is doing while it happens. A reclaim on rising volume and a reclaim on dead volume look identical on the price chart and mean completely different things. Use VWAP as one input, confirm it with volume, and treat every touch of the line as a question rather than an automatic answer.
Comments (0)