
In one sentence: Volume nodes are price levels where large orders actually filled, and price bounces off them harder than off random horizontal lines because real capital is defending its position.
What this actually is
Every horizontal line drawn on a chart is a guess. It might be a decent guess - a prior swing low, a round number, a Fibonacci retracement - but it is a guess about where price might react. A volume node is different. It is not a guess. It is a receipt of where real institutional orders actually filled. When price comes back to that level, those same participants tend to defend it because that is where their position lives.
Think of volume nodes like train stations. Price stops there because that is where a lot of buying and selling actually happened, not just where a random moving average sits. A random horizontal line is like a spot on the tracks with no station - the train passes through it because there is no reason to stop. A volume node is the station itself. Passengers get on and off. The train slows down. Sometimes it reverses direction entirely.
The insight: volume-confirmed levels reject price on first touch materially more often than random horizontal lines drawn off swing highs and lows. That gap between "structure" and "noise" is the entire edge of trading these levels.
The picture
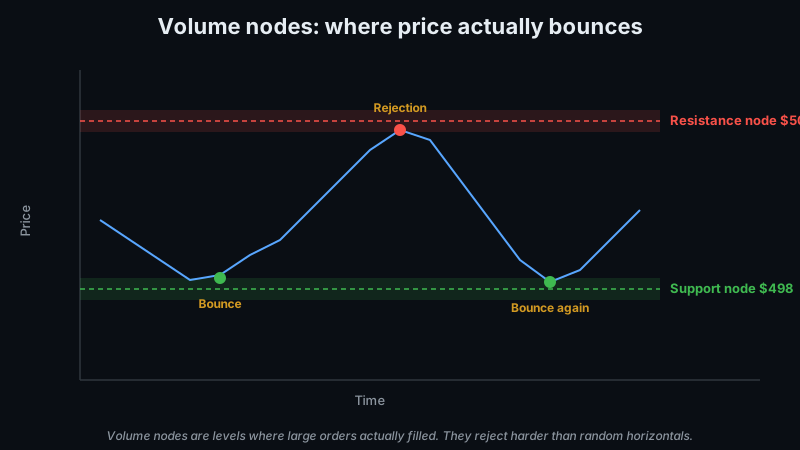
The diagram above shows the pattern. A green support band sits at $498 (where big volume printed on prior sessions). A red resistance band sits at $505 (same thing, but on the sell side). Price bounces off the green band twice - both times reversing higher within a few candles. When price wicks into the red band, it gets rejected and sells back down. Neither level is arbitrary. Both are volume signatures locked in by actual filled orders.
A real example: SPY at $499.20
SPY bounced off $498 as a confirmed volume node three times last month, on separate 5-minute closes across two sessions. The volume signature is locked. Today's premarket prints an inside-day pattern with no clear catalyst. Fifteen minutes into the session, SPY opens at $499.50 and drifts down to $498.30. RSI(2) on the 5-minute prints 8.
Put your buy limit at $498.20 - just above the volume node so you catch the bounce without needing a perfect fill. Set the stop at $496.80, below the node with a buffer for noise. Target the intraday swing high at $500.80. Risk is $1.40 per share. Reward if the level holds is $2.60 per share. That is a 1.9:1 payoff on a rejection setup with a meaningful edge over a random horizontal.
The video above walks through this setup live inside GenZTrade's Workbench, showing how the High Volume Points detector overlays the level and how the alert engine uses it as a confluence filter.
When it works best
- The volume node is confirmed, not forming. A "forming" node is still inside its detection window and could be invalidated by the next bar. Only trade confirmed levels with real size.
- You are trading with the trend the node was formed in. A support node in an uptrend is a buy-the-dip location. A resistance node in a downtrend is a sell-the-rally location. Fighting the higher-timeframe direction cuts the edge in half.
- VIX is below 30. Structural rejections lose reliability when the tape is expanding rapidly. During elevated-VIX regimes, take only broad-index setups and let single-name volume-node plays sit.
The rules that keep you profitable
Place stops beyond the level, never at it
A stop right at $498.00 on a level defended at $498.00 will get triggered by the noise wick before the real break happens. Give it a buffer - typically 30 cents to a dollar depending on the underlying's average intraday range. The level is a zone, not a pixel.
Respect the break when it happens
If price closes a 5-minute candle convincingly below a confirmed support node, that is the exit. Do not wait for further confirmation. Do not add hoping for the bounce. Volume nodes break decisively when they fail, because the same participants who were defending the level get flushed out and their stops become the selling pressure.
Never trade a forming (unconfirmed) node with size
The detection window has not closed. What looks like a pivot right now could still be invalidated. Paper trade these to develop the read, but risk real money only on confirmed levels.
Cap concurrent volume-node trades
These setups can cluster - a market-wide pullback can print the same rejection on five names at once. Taking all five at full size is a leveraged bet on the bounce, not a portfolio of independent trades. Cap concurrent exposure or scale into the strongest signal only.
Common mistakes I see
Confusing volume nodes with generic support and resistance
Most retail traders draw horizontal lines off swing highs and swing lows on a random 15-minute chart. Some of those matter (round numbers on major indices, moving averages the algo flow watches). Most are noise. The reason volume nodes are different is that someone actually bought or sold a lot of stock at that level and has an economic reason to defend it. Random swing points do not have that.
Trading rejection fades on high-VIX days
Volume nodes still print on volatile days, but their rejection reliability drops as the tape expands. A confirmed node that would normally hold gets punched through on a headline-driven move. Skip volume-node trades when VIX is above 30 and take defined-risk index spreads instead.
Moving the stop lower to "give it a chance"
The stop below the volume node with a small buffer is where the level fails. Moving that stop wider converts a defined-risk setup into an undefined-risk trade. If price broke the level, the trade is over. Take the loss.
Sizing without regard to the level's quality
Not every volume node is equal. A node with three prior touches over two sessions is stronger than a node with one touch a month ago. Scale position size to the number of prior tests and the volume signature at each test.
How GenZTrade helps you find these setups
- High Volume Points detector runs continuously on the entire scanner universe, and every confirmed level is stored and overlaid on the chart in the Workbench.
- Alert confluence uses volume-node proximity as a confidence filter on momentum alerts. Signals that line up with structure are promoted; signals in open space are treated as lower confidence.
- Regime detection filters volume-node plays out entirely on high-VIX days so the discipline is enforced automatically, not manually.
Bottom line
The idea is simple. When a momentum signal fires, the platform checks whether price is within striking distance of confirmed volume structure. If yes, the signal earns confluence and gets promoted. If price is nowhere near structure, the signal is treated as lower confidence. The net effect is fewer alerts overall and materially higher hit rate on the ones that come through. Trade structure, not noise.
Related reading
- Options plays: matching strategy to market regime
- Momentum scanner criteria: what actually predicts follow-through
- Bull put credit spread setup guide (with real trade examples)
Frequently asked questions
What are high volume points?
High volume points are price levels where an unusually large percentage of a stock's historical trading volume has occurred. These levels act as support and resistance because many market participants have positions established at those prices, creating natural buying and selling pressure.
How do I identify high volume points on a chart?
Use a volume profile indicator (available on most charting platforms) or scan for pivot bars with 2-3x average volume. The Point of Control (POC) is the single highest-volume price level; secondary POCs mark the next most important levels.
Are volume-based support levels more reliable than moving averages?
In range-bound markets, yes - volume profile levels have stronger memory than trend-following indicators. In strong trends, moving averages catch pullbacks better because the market prices past volume levels less relevant. Use both together, not either alone.
Comments (0)