
In one sentence: A momentum setup only follows through when price, volume, and trend all agree at the same time. Insist on all three before taking any breakout trade.
What this actually is
Most breakouts fail. That single sentence is why so many traders bleed the account trying to trade momentum - they see a stock breaking a prior day high, jump in, and watch the move roll back through their entry within the hour. The uncomfortable truth is that the majority of breakouts in liquid names are false, either because the volume was not real, the market context did not support the move, or the technical structure was already exhausted before the breakout candle printed.
Think of a momentum setup like a rocket launch. You need fuel (volume), a launch pad (breakout level), and thrust (price momentum) all at once. A rocket with no fuel just sits on the pad. A rocket with fuel but no thrust never leaves the ground. Only when all three are present does the launch actually work. Same with a breakout - three ingredients, all required, no exceptions.
The insight: single-filter breakouts are close to random. Multi-factor confirmed breakouts are a system. A good scanner earns its keep by insisting on the joint condition every time, without exception, even when you feel optimistic about a name.
The picture
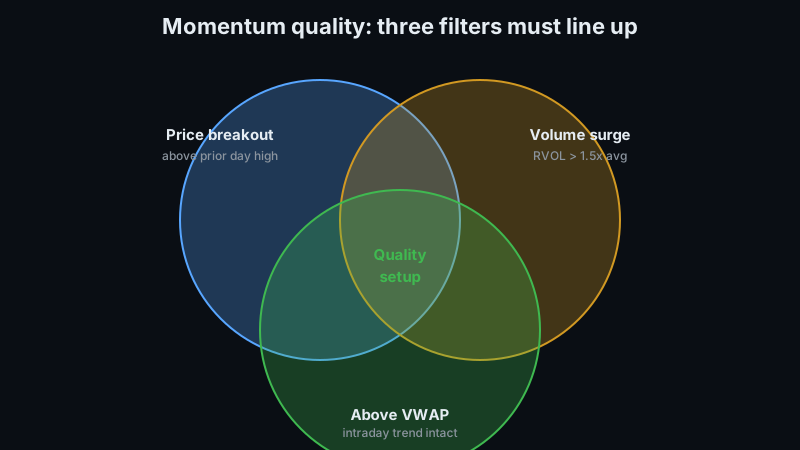
The diagram above is a three-circle Venn showing the overlap that matters. Circle one: price breaks the prior day high. Circle two: volume surges above 1.5x its recent average. Circle three: price stays above VWAP for the session. The small overlap in the middle - where all three fire together - is the quality setup zone. Everything outside that overlap is a probability-neutral breakout that will fail more often than it works.
A real example: NVDA at $135
NVDA closed yesterday at $133.20. The prior day high was $134.50, which had held as resistance for three sessions. This morning NVDA opens at $133.90, builds a base above $133 for the first hour, then at 11 AM breaks out with a wide-range candle to $135.50 on the 5-minute chart. Volume on that breakout candle is 8.2 million shares versus a 20-day average of 4.1 million for the same time slot - RVOL of 2.0. The candle closes at $135.30, well into the top third of its range. VWAP is at $134.10 and price sits above it.
All three circles of the Venn are green. Entry is $135.30, stop is $133.50 (below the breakout base), target is $138. Risk per share is $1.80. Reward per share is $2.70. That is a 1.5:1 payoff on a fully-confirmed multi-factor setup.
The video above walks through this setup live inside GenZTrade's Momentum Scanner, showing how the multi-factor gates auto-filter the candidate list down to the setups worth trading.
When it works best
- Above 20-day and 50-day moving averages. Multi-timeframe trend confirmation. A name breaking out while below its 50-day is a counter-trend move facing overhead supply from every prior holder still underwater.
- Sector is also up on the day. The sector ETF (XLK for tech, XLE for energy, etc.) up 0.5 percent or more. A single name breaking out while its sector fades is a warning that the move is idiosyncratic and vulnerable.
- Implied volatility is not blown out. If IV is at the 90th percentile, options premium for any bullish play is so rich that the setup does not have positive expected value even if the underlying continues. High IV on the day of the breakout often signals that a news event has already been priced in.
The rules that keep you profitable
Wait for the strong close
Not just a wick through the level. The close of the breakout candle should be in the top third of the candle's range, ideally at or above the prior day high. A wick with a lower close is a rejection, not a breakout. This one rule filters out most false breaks by itself.
Insist on RVOL above 1.5
Relative Volume is the day's volume divided by the average volume for that time of day. RVOL below 1.0 means less participation than usual - the breakout is on light interest and will not follow through. RVOL above 1.5 confirms real capital is behind the move.
Do not take breaks against SPY direction
A single name breaks out on a day when SPY is down 0.8 percent. The breakout may be technically valid but the correlation drag is real - even strong names get pulled down when the market and sector are working against them. Skip the setup and wait for alignment.
Size to setup quality, not gut feel
Setup quality is not binary. When every filter confirms unambiguously, that is a full-size entry. When one or two are marginal but the rest are strong, that is a smaller probe position. When too many filters miss, skip the trade. The probability of follow-through simply does not support the risk on partial confirmation.
Common mistakes I see
Chasing every candle that pokes above yesterday's high
A single-filter breakout - "closed above prior day high" with no other checks - follows through at rates just barely better than a coin flip. Traders who chase every one of these because "the level broke" grind down the account with commissions and slippage on setups that had no edge to begin with.
Trading pre-earnings breakouts
The name is breaking out three days before earnings and IV has already spiked to the 95th percentile. The move may follow through, but a long call has near-zero expected value because the premium is so bloated. Post-earnings the IV collapses and the call loses regardless of direction. Skip pre-earnings breakouts unless the earnings play itself is the entire thesis.
Adding to a losing breakout trade
The breakout failed, price is back below the level, and the temptation is to average down. What you are doing is doubling exposure to an invalidated thesis at a worse entry. Take the defined stop. The setup is over.
Ignoring the sector
Buying a tech name breakout on a day when XLK is down 0.7 percent means fighting the whole sector. Even a real breakout can fade because sector flows are working against it. The sector check exists for exactly this reason.
How GenZTrade helps you find these setups
- Momentum Scanner auto-runs multi-factor confirmation on every ticker in the universe every minute during market hours. Only qualifying setups surface - the noise of casual breakouts is filtered out before it ever hits your screen.
- High Volume Points confirm that the breakout level coincides with a meaningful volume node, not just an arbitrary technical.
- Regime detection throttles momentum alerts on chop-tagged days because follow-through statistics collapse in sideways tape.
Bottom line
Trading breakouts profitably is not about reading price faster than the next trader. It is about insisting on the joint condition of trend, volume, sector, and volatility before deploying capital - and skipping every setup that does not clear the bar. That discipline is what separates the traders who compound momentum edge over years from the ones who chase every candle. Run the checklist as a discipline for a month on paper. Log every setup and how the outcome tracks against how many filters confirmed. Partial confirmation wins at a materially lower rate than full confirmation. The scanner's insistence on the full checklist is not overkill - it is the entire source of edge.
Related reading
- Bull put credit spread setup guide (with real trade examples)
- How to spot chop days early and switch to income strategies
- Reading RSI(2) for oversold bounces: a systematic approach
Frequently asked questions
What criteria should a momentum scanner use?
Effective momentum scanners combine relative strength (stock outperforming index over 20-60 days), volume confirmation (above-average volume on breakouts), and technical structure (higher highs and higher lows). Single-metric scans produce too many false positives.
How many stocks should a momentum scan return per day?
In normal markets, 15-30 candidates on a 150-stock universe. Fewer than 10 signals a defensive market and you should reduce position size. More than 50 signals overheating and you should tighten filters or wait for the next cycle.
What is the difference between momentum and mean reversion?
Momentum bets that recent price direction continues (buy strong, sell weak). Mean reversion bets that recent price extremes revert (buy oversold, sell overbought). Both work but not simultaneously - you must identify the market regime first.
Comments (0)