
In one sentence: RSI(2) is a fast indicator that spots short-term panic in a rising stock, so you can buy the dip before the trend reasserts itself.
What this actually is
RSI(2) is the same Relative Strength Index most traders know, but with the lookback set to 2 periods instead of the default 14. That change turns a slow oscillator into a hair-trigger tool. On any given week it will hit oversold (below 5) or overbought (above 95) many times on a large-cap name - far more often than the 14-period version ever does.
Think of RSI(2) like a rubber band on the trend. The more it stretches down in a bullish stock, the harder the snap-back. When a name in a healthy uptrend prints an RSI(2) reading below 5, it usually means the last two sessions were a hard pullback but the higher-timeframe trend has not broken. Most of the time the trend reasserts and the stock bounces. That is the entire mechanical foundation of the signal.
The insight: RSI(2) by itself is close to a coin flip. Combined with a trend filter and a location filter, it becomes one of the highest-probability short-term mean-reversion signals available to a retail trader. The filters are the whole game.
The picture
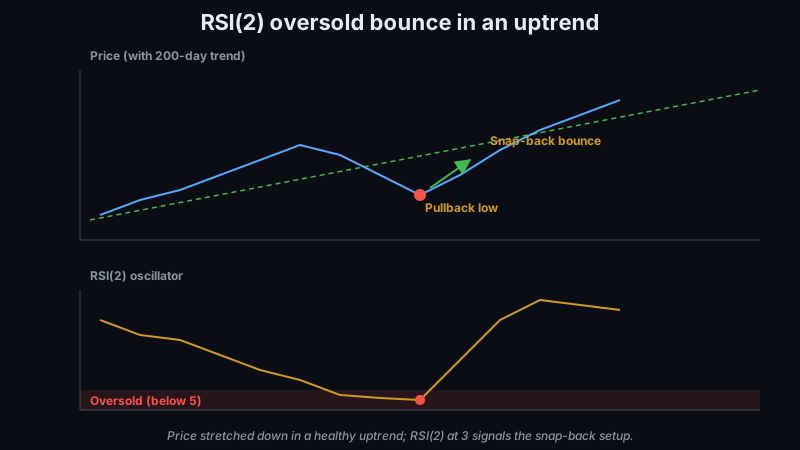
The diagram above shows the exact structure. The top panel is a rising stock with a sharp two-day pullback and then a snap-back bounce. The lower panel is the RSI(2) oscillator diving into the oversold zone (the red band below 5) right at the pullback low. That is the trigger. The trend line in the upper panel is what makes the setup high-probability - if that trend was pointing down, the same RSI(2) reading would be meaningless.
A real example: AAPL at $210
AAPL has been trending up all quarter and closes today at $210 after a three-day pullback from $216. The 200-day moving average sits at $198 - price is comfortably above it, so the trend filter is intact. RSI(2) closes at 3 today - deep oversold. A prior volume node from a two-week-old consolidation sits at $209.50, right under today's close.
Tomorrow morning AAPL opens at $210.20. Enter long at $210.20 with a stop at $208.50 (below the volume node with a buffer for noise). Initial target is $214 - the upper Bollinger band and a natural resistance from where the pullback started. Risk is $1.70 per share. Reward is $3.80 per share. That is a 2.2:1 payoff on a setup where the historical hit rate lands in the low 60s.
The video above walks through this setup live inside GenZTrade's Momentum Scanner, showing the trend filter, the RSI(2) trigger, and the volume node all in one view.
When it works best
- Stock is above its 200-day moving average. This is the trend filter. If price is below the 200-day, skip the trade no matter how oversold RSI(2) prints - in a downtrend, "oversold" often just means "getting more oversold."
- Price is near a volume node or prior support. Pullbacks into levels that have historically absorbed selling bounce harder than pullbacks into open air. If RSI(2) fires but the nearest volume level is 4 percent below, wait for the level.
- Volume declines on the pullback. Healthy pullbacks have fading volume - sellers are running out of ammunition. Increasing volume on the pullback suggests real distribution and a bounce is less likely.
The rules that keep you profitable
All five conditions must be present before entry
The exact checklist: stock above 200-day MA, RSI(2) closes below 5, price near a volume node, volume declining on the pullback, and entry on the next open with a stop 1 ATR below the pullback low. If any one of these is missing, skip the trade. The edge is in the joint probability of all five aligning.
Respect the stop as written
The stop 1 ATR below the pullback low is critical. Traders who widen the stop "to give it room" are converting a defined-risk mean-reversion setup into an undefined-risk position trade. If the original stop was correct, the level below it does not deserve to be tested with your capital.
Never add to a losing trade
The temptation is to think "the setup is even better now" and double up. What you are actually doing is doubling your exposure to a thesis the price action has already invalidated. If the stop hits, take the loss. Do not average down.
Cut size when correlations are high
On a broad market pullback, RSI(2) can produce three or four signals at once. Taking all of them at full size is a leveraged bet on the market bounce, not a portfolio of independent trades. Cut size or take only the highest-conviction signal.
Common mistakes I see
Taking signals in a downtrending name just because SPY is up
The 200-day filter is meant to prevent this, but the S&P 500 can be above its 200-day while a specific name is in its own downtrend. If the underlying is above its 200-day but has broken clear 50-day support and is making lower highs on the daily, the trade is directionally wrong even if the mechanical rules trigger.
Chasing the setup after the bounce has already started
The rules say enter on the next session's open, not on the bounce candle itself. Chasing an already-moving bounce means paying up on entry and having a wider stop distance to the pullback low. Wait for the next open.
Trading short RSI(2) signals in a bull regime
Short-side RSI(2) setups have a lower hit rate because bull-market drift makes shorting counter-trend harder. Take short RSI(2) signals only when the market regime is clearly bearish - VIX above 25, SPY below its 50-day, sector breadth negative.
Ignoring earnings
Do not take an RSI(2) trade heading into a name's earnings report. The pullback may be part of a pre-earnings de-risking that continues right through the release. If earnings are within the trade's expected holding window, skip it.
How GenZTrade helps you find these setups
- Workbench Scanner lets you build a custom filter combining "RSI(2) less than 5", "price above 200-day MA", and "volume declining over last 3 days" as a saved scan across the full universe.
- Momentum Scanner auto-surfaces qualifying RSI(2) setups when the underlying is in a broader momentum pattern - trend intact, sector strong, pullback in the trend rather than a breakdown.
- High Volume Points overlays support levels on the chart so the location filter is not a manual guess. If RSI(2) fires but no volume level is nearby, you can see immediately that the setup is missing a leg.
Bottom line
RSI(2) works because it identifies short-term stretched conditions and lets you trade them in the direction of the higher-timeframe trend. It fails when you use it stripped of the trend, location, and volume filters that give it edge. Paper trade the system for a month before risking real capital. Run the checklist manually on ten setups per week, log the results, and compare the joint-condition hit rate to your intuition. The discipline of waiting for all five conditions is much harder than the entry mechanics themselves - and when you nail the discipline, the R math takes care of the rest.
Related reading
- Bull put credit spread setup guide (with real trade examples)
- How to spot chop days early and switch to income strategies
- Momentum scanner criteria: what actually predicts follow-through
Frequently asked questions
What is the RSI-2 strategy?
RSI-2 is a short-term mean-reversion strategy using a 2-period Relative Strength Index. You buy pullbacks when RSI-2 crosses below 10 (extreme oversold) in an established uptrend and exit when RSI-2 crosses above 70 or price closes above the 5-day moving average.
Does the RSI-2 strategy still work?
Yes, but only in strong-trend market regimes. RSI-2 mean-reversion trades lose money in bear markets and choppy sideways action because the underlying assumption (pullbacks resolve up) breaks. Filter by 200-day moving average trend direction before entering.
What is the win rate of the RSI-2 strategy?
Historically 65-75% win rate on liquid large caps when combined with a 200-day MA trend filter. Individual trade returns are small (1-3% per trade) so consistent execution and correct position sizing matter more than any single trade outcome.
Comments (0)